RTVU higher education focuses on cultivating specialized local professionals that can play a long-term role in local economic development, demonstrating the RTVUs’ commitment to training local human resources and its ultimate goal of serving local economic development. Therefore, this study theorizes that since RTVU higher education should interact positively and develop along with the national economy, this positive interaction will be embodied in the relationship between RTVU higher education enrollment and gross domestic product (GDP). To justify our hypothesis, we set out to explore this relationship using two groups of data: RTVU higher education enrollment and GDP from 1989 to 2009 (As shown in Table 1; data is taken from the China RTVU Educational Statistical Yearbook (2009)[3] and the China Statistical Yearbook: 2010[4]).
Table 1: GDP and RTVU Higher Education Enrollment
|
Year
|
RTVU Higher Education Enrollment (10 thousand people)
|
GDP (100 billion RMB)
|
|
1989
|
12.5
|
16.99
|
|
1990
|
11.2
|
18.67
|
|
1991
|
10.4
|
21.78
|
|
1992
|
14.4
|
26.92
|
|
1993
|
21.9
|
35.33
|
|
1994
|
23.2
|
48.20
|
|
1995
|
24.25
|
60.79
|
|
1996
|
32.03
|
71.18
|
|
1997
|
31.29
|
78.97
|
|
1998
|
31.5
|
84.40
|
|
1999
|
33.05
|
89.68
|
|
2000
|
43.21
|
99.21
|
|
2001
|
55.69
|
109.66
|
|
2002
|
59.39
|
120.33
|
|
2003
|
61.54
|
135.82
|
|
2004
|
76.01
|
159.88
|
|
2005
|
73.46
|
184.94
|
|
2006
|
76.33
|
216.31
|
|
2007
|
79.76
|
265.81
|
|
2008
|
92.82
|
314.05
|
|
2009
|
101.44
|
340.51
|
Firstly, we conducted a SPSS13.0 Pearson Correlation Analysis to establish the relativity of the two groups of data. We found a correlation coefficient of 0.960 (sig.<0.01), indicating a significant positive correlation.
We then drew a scatter diagram of the two groups of data to establish whether they have a linear relationship. As shown in Figure 1, RTVU higher education enrollment is plotted on the horizontal axis while GDP is plotted on the vertical axis. When the two groups of data for the past 20 years are marked on the diagram, the 20 dots are distributed evenly on both sides of a straight line, proving that there is a linear relationship between RTVU higher education enrollment and GDP during this period. We can use linear regression analysis to further establish the linear regression equation between the two groups.
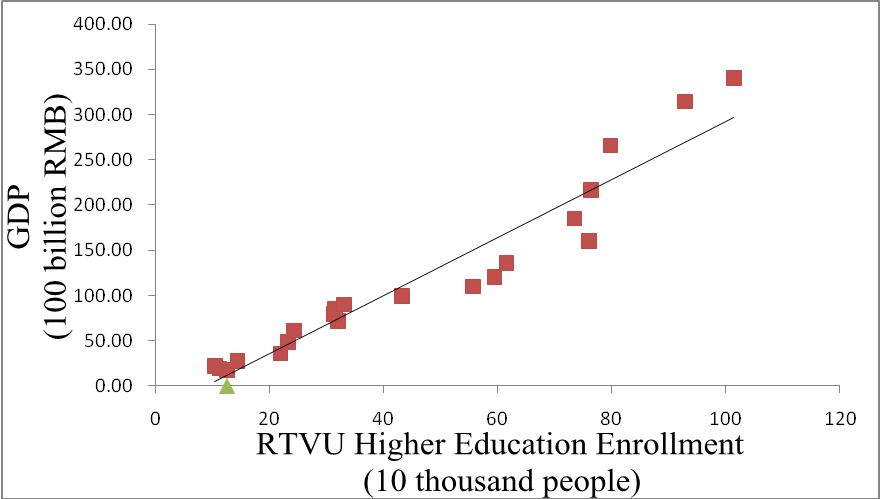
Figure 1: Scatter Diagram Analysis
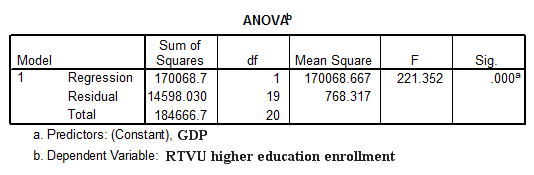
Using the SPSS13.0 linear regression analysis algorithm, the authors conducted a linear regression analysis of the two variables, using GDP (100 billion RMB) as the independent variable and RTVU higher education enrollment (100 thousand people) as the dependent variable. The variance test gave the results shown in Table 2.
Table 2: Results of the Variance Test